Enterprise-Grade Database Monitoring: Percona Monitoring and Management in FILESS

Your database is running. But is it really running well?
You check your application logs. Everything seems fine. Your users aren't complaining. But deep down, you know you're flying blind. You have no idea if:
- Your queries are getting slower over time
- Your connection pool is about to hit the limit
- Your disk I/O is becoming a bottleneck
- Your replication lag is growing
In the old days, you'd cobble together a monitoring solution: install Prometheus, configure Grafana, write custom exporters, set up alerting rules. Weeks of work, and you'd still miss critical metrics.
Filess.io solves this by providing Percona Monitoring and Management (PMM) out of the box on all Dedicated Runtime databases.
The Pain: Building Your Own Monitoring Stack
Setting up comprehensive database monitoring from scratch is a nightmare:
- Install Prometheus: Set up the time-series database, configure retention, manage storage.
- Deploy Exporters: Install
mysqld_exporter, configure authentication, expose metrics endpoints. - Build Grafana Dashboards: Create dashboards from scratch, figure out which metrics matter, design visualizations.
- Configure Alerting: Write PromQL queries, set thresholds, integrate with PagerDuty/Slack.
- Maintain Everything: Keep exporters updated, fix broken dashboards, tune retention policies.
And even after all that work, you're still missing enterprise features like:
- Query Analytics to identify slow queries
- Database advisors that suggest optimizations
- Historical performance trends
- Security auditing capabilities
The Solution: Percona Monitoring and Management Built-In
Percona Monitoring and Management (PMM) is an open-source platform for managing and monitoring MySQL, MariaDB, PostgreSQL, and MongoDB performance. It's the same tool used by companies like GitHub, Slack, and Etsy to monitor their databases.
On Filess.io, PMM is pre-configured and ready to use on every Dedicated Runtime database.
What You Get Out of the Box
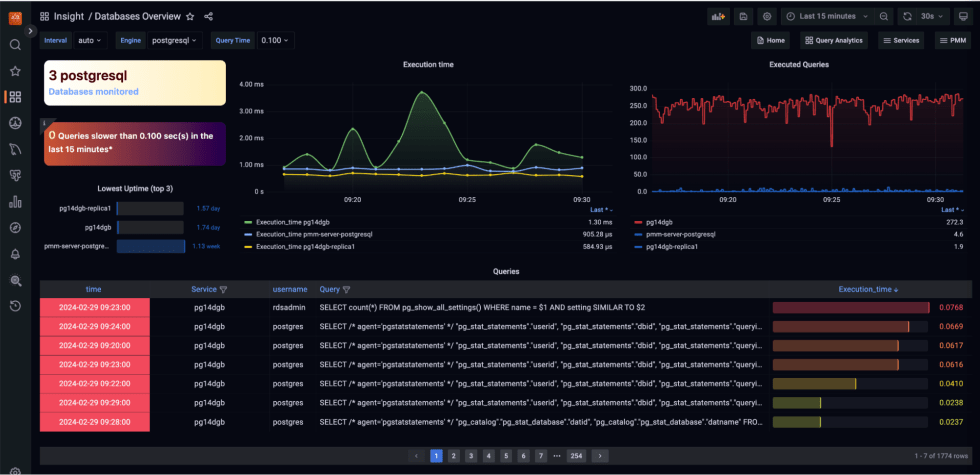
Query Analytics: See exactly which queries are slow, how often they run, and where they're spending time.
Performance Metrics: Real-time monitoring of connections, queries per second, replication lag, buffer pool usage, and more.
Database Advisors: Automated recommendations for query optimization, index creation, and configuration tuning.
Security Monitoring: Track authentication failures, privilege escalations, and suspicious activity.
Historical Data: Keep months of performance data for capacity planning and trend analysis.
Custom Dashboards: Pre-built dashboards for MySQL/MariaDB with the most important metrics at a glance.
How It Works in FILESS
When you deploy a database on Filess.io Dedicated Runtime:
- PMM Server is automatically deployed alongside your database cluster
- PMM Client agents are installed on each database node
- Metrics collection starts immediately - no configuration needed
- Dashboards are pre-configured with best-practice visualizations
You don't need to:
- Install any software
- Configure exporters
- Write PromQL queries
- Build dashboards
- Set up alerting infrastructure
It just works.
Key Features of PMM in FILESS
Query Analytics Dashboard
Identify performance bottlenecks at a glance:
- Top slow queries: See which queries are taking the most time
- Query patterns: Group similar queries to find optimization opportunities
- Execution plans: Understand how queries are being executed
- Index recommendations: Get suggestions for missing indexes
Performance Monitoring
Monitor all critical database metrics:
- Connection metrics: Active connections, connection errors, max connections
- Query performance: Queries per second, slow queries, query response times
- Resource usage: CPU, memory, disk I/O, network I/O
- InnoDB metrics: Buffer pool usage, read/write operations, lock waits
- Replication: Replication lag, replication status, binlog position
Database Advisors
Get automated recommendations for:
- Query optimization: Identify queries that could benefit from indexes
- Configuration tuning: Suggestions for
my.cnfoptimizations - Index analysis: Find missing or unused indexes
- Table optimization: Recommendations for table maintenance
Alerting
Set up alerts for:
- High connection count
- Slow query rate
- Replication lag
- Disk space usage
- Memory pressure
- CPU utilization
Real-World Example: The Slow Query Mystery
Imagine your Example App starts experiencing intermittent slowdowns. Users report pages taking 5+ seconds to load.
Without PMM: You'd spend hours digging through logs, running SHOW PROCESSLIST, trying to correlate application metrics with database performance. You might never find the root cause.
With PMM in FILESS:
- Open the PMM dashboard (accessible from your Filess.io console)
- Navigate to Query Analytics
- See immediately that a specific
SELECTquery is taking 3+ seconds - Click on the query to see its execution plan
- PMM Advisor suggests adding an index on
customer_id - You add the index, and the problem is solved
All in under 10 minutes.
Why Percona Monitoring and Management?
PMM is the industry standard for database monitoring because:
- Open Source: No vendor lock-in, fully auditable
- Enterprise-Grade: Used by companies managing thousands of databases
- Comprehensive: Covers all aspects of database performance
- Active Development: Regular updates with new features and improvements
- Community Support: Large community of users and contributors
Best Practices for Database Monitoring
With PMM in FILESS, you can:
- Monitor proactively: Set up alerts before issues impact users
- Optimize continuously: Use Query Analytics to find slow queries regularly
- Plan capacity: Use historical data to predict when you'll need to scale
- Troubleshoot quickly: When issues arise, you have all the data you need
- Document performance: Use dashboards to communicate database health to stakeholders
Get Started Today
Every Dedicated Runtime database on Filess.io includes Percona Monitoring and Management at no additional cost. No setup, no configuration, no maintenance.
Stop flying blind. Start monitoring like the pros.